

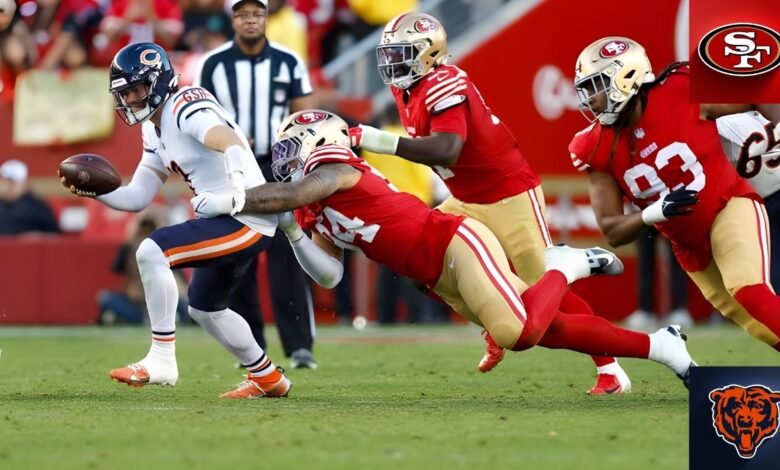
The latest completed meeting between Chicago and San Francisco ended with a 42–38 49ers win on December 28, 2025, at Levi’s Stadium. The high-scoring Week 17 game featured two productive quarterbacks, several long touchdowns, and a late change of lead. This breakdown looks at the passing, rushing, and receiving numbers behind the result, along with the plays that shaped the finish.
The stats show two different offensive strengths. Caleb Williams threw for more yards, while Brock Purdy produced five total touchdowns through the air and on the ground. San Francisco gained more total yards and controlled the ball longer, but Chicago stayed close by scoring quickly and turning an early interception into a touchdown.
Game Overview
Chicago opened the scoring with a defensive play: linebacker T.J. Edwards intercepted Purdy’s first pass and returned it 34 yards for a touchdown. The 49ers answered with a touchdown drive, and the teams continued trading scores. San Francisco led 28–21 at halftime, but the Bears kept pace in the second half and briefly moved ahead in the fourth quarter.
The lead changed again in the final minutes. Chicago went up 38–35 on Cairo Santos’ 29-yard field goal with 5:26 remaining. Purdy then connected with Jauan Jennings for a 38-yard touchdown, putting San Francisco ahead 42–38. Williams led the Bears downfield for a final chance, but the 49ers stopped his pass in the end zone as time expired.
Quarterback Comparison
Caleb Williams’ passing line
Williams completed 25 of 42 passes for 330 yards, two touchdowns, and no interceptions. His completion rate was about 59.5%, and he averaged 7.9 yards per attempt. The yardage total led both teams, and his two deep touchdown passes helped Chicago answer San Francisco’s scoring drives. The 330 yards, however, did not translate into a win.
Williams’ performance combined productive throws with a high number of attempts. He finished with 42 passes, compared with Purdy’s 33, as Chicago relied more heavily on its passing game. Williams also ran five times for 18 yards. Those carries added some movement outside the pocket, though they were a smaller part of Chicago’s offense than Purdy’s rushing contribution was for San Francisco.
Brock Purdy’s passing line
Purdy completed 24 of 33 passes for 303 yards, three touchdowns, and one interception. His completion rate was approximately 72.7%, and he averaged 9.2 yards per attempt based on the passing line. Edwards’ pick-six gave Chicago seven points, but Purdy recovered and directed several scoring drives, including the late touchdown that decided the game.
The quarterbacks’ passing numbers were close in yardage, but their game totals differed in how they reached the end zone. Williams threw two touchdown passes and had no interceptions; Purdy threw three touchdowns, was intercepted once, and added two rushing scores. That gave Purdy five touchdowns responsible for, a key part of San Francisco’s six offensive touchdowns.
What the quarterback comparison shows
A simple comparison of passing yards would favor Williams, who finished 27 yards ahead. But the box score also shows why passing yards alone cannot explain the result. Purdy completed a higher share of his passes, threw one more touchdown, and scored twice on the ground. San Francisco’s ability to convert those plays into touchdowns helped offset the early pick-six.
Williams still gave Chicago a chance to win late. He moved the offense into position for a final attempt after San Francisco retook the lead. The last pass fell incomplete in the end zone, so the comeback stopped there. His final line reflects a strong yardage performance, but the late drive and team result also depended on protection, play selection, and the defense’s ability to make a stop.
Rushing Leaders
Christian McCaffrey leads San Francisco on the ground
McCaffrey led all rushers with 23 carries for 140 yards and one touchdown. His longest run covered 41 yards, and he averaged just over six yards per carry. He also caught four passes for 41 yards, giving him 181 yards from scrimmage. His combined rushing and receiving work helped San Francisco sustain drives and keep Chicago’s defense occupied.
McCaffrey’s rushing total was the largest single-player contribution in the ground game. He offered a steady option between explosive runs, while Purdy’s scrambles added a separate threat. Together, those two players accounted for 168 of the 49ers’ 200 rushing yards. San Francisco’s team total was 90 yards higher than Chicago’s, a substantial difference in a game decided by four points.
D’Andre Swift keeps Chicago in the game
Swift carried nine times for 54 yards and scored twice. His longest run was 22 yards, and both touchdowns came on runs that gave Chicago important second-half points. He also caught two passes for 25 yards. Swift’s 79 yards from scrimmage were useful, but his two rushing touchdowns were the most direct part of his impact on the scoreboard.
Kyle Monangai added eight carries for 38 yards, while Williams gained 18 yards on five attempts. Chicago’s 110 rushing yards came on 22 attempts, a five-yard average. The Bears had effective individual runs, including Swift’s long scoring play, but they did not match San Francisco’s overall rushing volume or total production.
Purdy’s rushing touchdowns
Purdy ran six times for 28 yards and two touchdowns. His scoring runs included gains of 10 and three yards. Those carries made him more than a passer in the red zone and gave San Francisco additional ways to finish drives. When combined with McCaffrey’s touchdown run, the 49ers recorded three rushing touchdowns.
The rushing scores also explain the difference between Purdy’s passing totals and his overall scoring impact. His three touchdown passes were complemented by two runs into the end zone. In close games, that dual contribution can shape how a defense allocates attention near the goal line, though this single game does not by itself establish a broader trend.
Receiving Leaders
Luther Burden III tops Chicago’s receiving chart
Burden caught eight passes for 138 yards and a touchdown, leading the Bears in receptions and receiving yards. His longest catch went for 35 yards, and that play was also a touchdown. The rookie receiver was a major part of Chicago’s explosive passing attack, making the most of his opportunities and helping Williams stretch the field.
Cole Kmet and Colston Loveland also contributed, with Loveland recording six catches for 94 yards and a touchdown. His 36-yard scoring reception gave Chicago another big play. Kmet finished with two catches for 16 yards. Together, Burden and Loveland accounted for 232 receiving yards and both of Williams’ touchdown passes.
San Francisco spreads the receiving production
Ricky Pearsall led the 49ers in receiving yards with five catches for 85 yards. Jake Tonges caught seven passes for 60 yards and a touchdown, while Jennings finished with two receptions for 42 yards, including the late 38-yard go-ahead score. Fullback Kyle Juszczyk caught two passes for 14 yards and also scored.
San Francisco’s receiving totals were spread across several players rather than concentrated in one high-yardage performance. Purdy connected with multiple targets to keep drives moving and finish scoring chances. McCaffrey added four catches for 41 yards, complementing his 140 rushing yards. That combination gave the 49ers a reliable short option as well as a potent ground game.
Explosive plays and scoring chances
Both teams used long completions to create touchdowns. Chicago scored through Burden’s 35-yard catch and Loveland’s 36-yard reception. San Francisco’s final touchdown came on Jennings’ 38-yard grab. These plays changed field position quickly and helped produce a combined 80 points, but the game was not only a contest of deep passes; San Francisco also converted red-zone possessions into touchdowns.
The red-zone figures highlight one of the clearest differences. San Francisco scored touchdowns on all five of its red-zone trips, while Chicago scored a touchdown on one of three such opportunities. Chicago’s other visits resulted in a field goal and a missed chance to finish a drive with seven points. In a four-point game, those outcomes had direct consequences.
Team Statistics and Game Context
Total yards, possession, and first downs
The 49ers gained 496 total net yards on 68 plays, compared with Chicago’s 440 yards on 64 plays. San Francisco averaged 7.3 yards per play; Chicago averaged 6.9. The 49ers also held the ball for 33 minutes and 33 seconds, almost seven minutes longer than the Bears. San Francisco’s 32 first downs were six more than Chicago’s 26.
Those team figures point to a small but meaningful advantage in sustained offense for San Francisco. Chicago produced more passing yards, while the 49ers gained more on the ground and had more time with the ball. The Bears’ defense still created a turnover and gave the offense a quick seven points, but the 49ers’ drive efficiency helped them keep answering.
Third downs and penalties
San Francisco converted seven of 10 third-down attempts, while Chicago converted six of 12. The Bears were perfect on two fourth-down attempts, and San Francisco converted its only fourth-down try. Chicago had seven penalties for 39 yards; the 49ers had five for 55 yards. Penalty yardage favored the Bears, but San Francisco’s success on third down helped it maintain possession.
Neither team lost a fumble, and the only interception was Purdy’s opening pass. Chicago’s turnover return became a touchdown, but it was the teams’ only takeaway. The Bears did not add another interception or fumble recovery later in the game, while the 49ers’ defense made the decisive stop on Williams’ final throw.
How the game turned late
After the teams traded touchdowns early in the third quarter, San Francisco went ahead 35–28 on Purdy’s touchdown pass to Juszczyk. Chicago responded with Swift’s second rushing score, tying the game at 35. Santos’ field goal then put the Bears ahead by three, giving the 49ers a short window to respond.
Purdy’s final scoring drive lasted seven plays and covered 70 yards. Jennings’ touchdown reception came with 2:23 remaining, and the extra point made the score 42–38. Williams then drove Chicago toward a potential winning score. The 49ers’ last defensive stand, rather than an earlier statistical advantage alone, settled the outcome.
What the Player Stats Tell Us
The box score gives a clear picture of contrasting approaches. Chicago relied more on its passing game and got strong receiving performances from Burden and Loveland. San Francisco paired Purdy’s efficient passing with McCaffrey’s 140 rushing yards and Purdy’s own two rushing touchdowns. That balance helped the 49ers score six offensive touchdowns.
The numbers also show why the result should not be reduced to a quarterback rating or one player’s yardage total. Williams led in passing yards, and Chicago scored a defensive touchdown, yet San Francisco gained more total yards and converted every red-zone trip into a touchdown. The Bears were close throughout, but the 49ers made the final scoring play and the final defensive stop.
Final Thoughts
The December 28, 2025 matchup was a close, high-scoring game in which both offenses produced big plays. Williams threw for 330 yards and two touchdowns, while Purdy had 303 passing yards, three passing scores, and two rushing touchdowns. Burden, Loveland, McCaffrey, Swift, and Jennings each had defining contributions.
San Francisco’s 42–38 win reflected its stronger rushing total, longer possession time, and perfect red-zone touchdown rate. Chicago had enough offense to lead late and a final chance to win, but it could not complete the last drive. For readers comparing the player stats, the most useful takeaway is how each team’s passing, rushing, and scoring efficiency combined to shape the finish.
Frequently Asked Questions
1. Which team won the latest Bears vs. 49ers game?
The San Francisco 49ers defeated the Chicago Bears 42–38 on December 28, 2025. The game was played at Levi’s Stadium in Santa Clara, California, during Week 17 of the NFL regular season.
2. How many passing yards did Caleb Williams have?
Williams threw for 330 yards, completing 25 of 42 passes. He had two touchdown passes and no interceptions in the game.
3. What were Brock Purdy’s passing stats?
Purdy completed 24 of 33 passes for 303 yards, three touchdowns, and one interception. He also ran for two touchdowns, bringing his total touchdowns to five.
4. Who led the game in rushing yards?
Christian McCaffrey led all players with 140 rushing yards on 23 carries. He scored one rushing touchdown and added 41 receiving yards.
5. How many touchdowns did D’Andre Swift score?
Swift scored two rushing touchdowns for Chicago. He finished with 54 rushing yards on nine carries and added 25 receiving yards.
6. Who led Chicago in receiving yards?
Luther Burden III led the Bears with 138 receiving yards on eight catches. He also scored one touchdown, his longest reception covering 35 yards.
7. Who caught the 49ers’ late go-ahead touchdown?
Jauan Jennings caught a 38-yard touchdown pass from Purdy with 2:23 left in the fourth quarter. The score gave San Francisco a 42–38 lead.
8. What was the biggest team-stat difference?
The 49ers gained 200 rushing yards, compared with 110 for Chicago. They also held possession for 33:33, while the Bears had the ball for 26:27.
9. Did either quarterback throw multiple interceptions?
No. Williams did not throw an interception. Purdy threw one, which Edwards returned 34 yards for a Chicago touchdown.
10. How did the game end?
Chicago drove toward a potential winning score in the closing seconds. The final pass was incomplete in the end zone, allowing San Francisco to preserve its 42–38 lead.
Recommended: Jacksonville Jaguars vs Chicago Bears Match Player Stats: Passing, Rushing, and Receiving

One Comment