

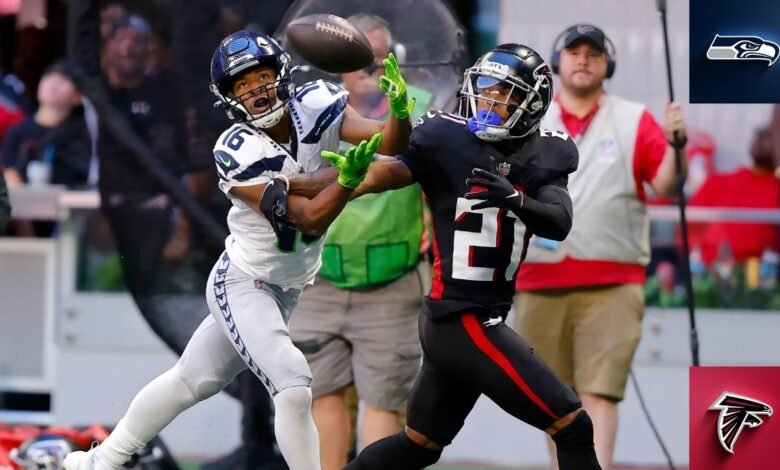
Seattle defeated Atlanta 37–9 at Mercedes-Benz Stadium on December 7, 2025, but the final score hides how competitive the opening half was. The teams reached halftime tied 6–6 before Seattle took control through a kickoff return, sharper passing, and three defensive takeaways. This Seahawks vs Atlanta Falcons Match Player Stats breakdown covers that Week 14 game, explaining the individual performances and team numbers behind the result. Sam Darnold delivered three touchdown passes, Jaxon Smith-Njigba scored twice, and Rashid Shaheed changed the game on special teams. Atlanta moved the ball in stretches but never scored a touchdown.
Game Context and Quarter-by-Quarter Scoring
The victory moved Seattle to 10–3, while Atlanta dropped to 4–9. Both teams scored three points in the first quarter and another three in the second. Seattle then won the third quarter 17–0 and the fourth 14–3. That created a 31–3 second-half advantage and the final 28-point margin. Atlanta actually led the first-half yardage comparison 151–111, so this was not a game Seattle controlled from the opening possession. Its decisive improvement came after halftime, when scoring opportunities became touchdowns and Atlanta’s mistakes became Seattle possessions.
Sam Darnold’s Passing Performance
Darnold completed 20 of 30 passes for 249 yards, three touchdowns, and one interception, finishing with a 111.7 passer rating. His performance changed sharply between halves. He completed nine of 15 throws for 67 yards before halftime, then 11 of 15 for 182 yards afterward, with all three touchdowns coming after the break. On the touchdown drive following Atlanta’s lost fumble, he completed all five attempts for 80 passing yards during an 88-yard possession. His longest completion covered 33 yards. Darnold also added 23 rushing yards, extending possessions with his legs.
Kirk Cousins and Atlanta’s Passing Game
Kirk Cousins also attempted 30 passes, but completed 15 for 162 yards, no touchdowns, and two interceptions. His passer rating was 38.5, and his average of 5.4 yards per attempt fell well below Darnold’s 8.3. Kyle Pitts supplied much of Atlanta’s receiving production, but the wider passing attack remained limited. Darnell Mooney finished with one catch for six yards, while David Sills had no receptions. Both interceptions came after halftime, when Atlanta needed sustained drives to answer Seattle’s scoring. They ended possessions outright, removing opportunities to reduce the deficit.
Rushing Leaders and Ground-Game Efficiency
Bijan Robinson led all rushers with 86 yards on 20 carries, averaging 4.3 yards, while Tyler Allgeier added 34 yards on 11 attempts. Atlanta finished with 120 rushing yards but no rushing touchdowns. Seattle gained 129 yards on 26 carries, distributing the work more widely. Zach Charbonnet led the Seahawks with 46 yards on seven attempts, Kenneth Walker III contributed 29 on ten, and Velus Jones Jr. added 32 on four. Charbonnet’s 27-yard run accounted for more than half his total. The comparison shows why carry totals alone can mislead: Walker had the most Seattle attempts, while Charbonnet produced more yards from fewer opportunities.
Receiving Leaders and Touchdown Contributions
Smith-Njigba led Seattle with seven catches for 92 yards and two touchdowns, scoring on passes of 28 and four yards. Shaheed added four catches for 67 yards, including the game’s longest completed pass at 33 yards. Cooper Kupp caught two passes for 35 yards and an 11-yard touchdown, giving Seattle three scoring receptions across two receivers. AJ Barner contributed 27 yards, Charbonnet added 20, and Cody White gained nine. For Atlanta, Pitts finished with six catches for 90 yards, followed by Allgeier with 33 and Dylan Drummond with 21. Pitts nearly matched Smith-Njigba’s yardage, but their touchdown totals made the biggest difference in scoring impact.
Defensive Standouts on Both Teams
Nick Emmanwori recorded six combined tackles, two tackles for loss, one sack, and an interception, while also blocking a field goal on special teams. Devon Witherspoon added seven combined tackles, an interception, and a fumble recovery. He also broke up the pass that became Emmanwori’s interception, linking two defensive contributions on one play. DeMarcus Lawrence forced Robinson’s fumble, and Ernest Jones IV led Seattle with 11 combined tackles. Atlanta had notable individual efforts too: A.J. Terrell recorded eight combined tackles and forced a fumble, while Mike Hughes intercepted Darnold. Seattle’s advantage came from converting defensive plays into possession changes and then adding points on offense.
Special Teams and the Momentum Shift
Shaheed returned the opening kickoff of the second half 100 yards for a touchdown, turning a tied game into a 13–6 Seattle lead within 12 seconds. The play supplied seven points without requiring an offensive drive and forced Atlanta to respond immediately. Seattle also benefited from Jason Myers, who made field goals from 22, 48, and 37 yards and converted all four extra points. Zane Gonzalez supplied Atlanta’s entire nine-point total with field goals from 35, 43, and 27 yards. His other attempt, from 50 yards, was blocked by Emmanwori. That block prevented Atlanta from scoring after Hughes had given its offense possession in Seattle territory.
Turnovers and the Decisive Scoring Drives
Atlanta’s three turnovers produced 17 Seattle points on the possessions that followed. Robinson’s third-quarter fumble was recovered by Witherspoon at Seattle’s 12-yard line, ending a promising Falcons drive. Seattle then traveled 88 yards and scored through Smith-Njigba. Emmanwori’s interception gave the Seahawks the ball at Atlanta’s 47, leading to Myers’ 37-yard field goal. Witherspoon’s fourth-quarter interception set up a 35-yard touchdown drive, completed by Smith-Njigba’s second scoring catch. These possessions explain how the margin grew without requiring every Seattle drive to cover most of the field. Atlanta lost scoring chances while also giving Seattle additional opportunities, including two starts in Falcons territory.
Team Statistics That Explain the Result
Seattle finished with 365 total offensive yards to Atlanta’s 274, averaging 6.3 yards per play against 4.4. The Seahawks produced 20 first downs, compared with 15 for the Falcons, and held possession for 31 minutes, 20 seconds against 28 minutes, 40 seconds. The modest possession gap shows that Seattle’s win depended more on productive plays and finishing drives than on keeping the ball for an overwhelming share of the game. Penalties also deserve a balanced reading: Atlanta committed eight for 56 yards, while Seattle had six for 60. Seattle therefore had fewer penalties but actually lost more penalty yardage, making discipline an incomplete explanation for the score.
Final Thoughts
Seattle’s 37–9 victory was built across offense, defense, and special teams. Darnold’s second-half improvement gave the Seahawks a reliable passing finish, Smith-Njigba supplied two touchdowns, and Shaheed delivered the opening score after halftime. Witherspoon and Emmanwori helped stop Atlanta’s attempts to recover, while Myers converted every kick. Robinson and Pitts still produced useful yardage for the Falcons, so describing their entire offense as ineffective would overlook individual contributions. The larger failure was turning those gains into touchdowns and protecting possession when the game remained within reach. Reading the player totals alongside the scoring sequence gives a clearer account than the final score alone.
Frequently Asked Questions
1. Which Seahawks–Falcons game does this breakdown cover?
This article covers the regular-season game played in Atlanta on December 7, 2025, during Week 14 of the 2025 NFL season. Seattle won 37–9 at Mercedes-Benz Stadium. These figures belong to that specific meeting, so they should not be combined with player totals from earlier games between the teams. Starting quarterbacks and player roles can differ between seasons.
2. Why do the quarterback passing yards differ from team net passing yards?
Darnold’s 249 passing yards became 236 net passing yards after Seattle’s 13 yards lost on sacks were deducted. Cousins’ 162 became Atlanta’s 154 after an eight-yard sack loss. The quarterback passing line reports yards gained on completed throws, while the team net figure also accounts for sacks. Adding net passing yards to rushing yards produces each team’s total offensive yardage: 365 for Seattle and 274 for Atlanta.
3. Who received the most targets in the game?
Smith-Njigba and Pitts each received ten targets. Smith-Njigba caught seven of those passes, while Pitts caught six, producing catch rates of 70% and 60%, respectively. Shaheed caught four of five targets, an 80% rate. Targets help show how often an offense tried to involve a player, but catch rate alone does not measure difficulty, coverage, or scoring value. A heavily contested deep throw differs from a short completion.
4. Which Seattle runner had the highest yards-per-carry average?
Jones averaged 8.0 yards on four carries, the highest figure among Seattle players with positive rushing totals. His 25-yard run supplied most of his 32 yards, so the average came from a small workload containing one large gain. Charbonnet averaged 6.6 yards across seven attempts. Neither figure establishes superior performance across a full season; both describe this single game.
5. Why is Shaheed’s 100-yard return excluded from Seattle’s offensive yardage?
A kickoff return is a special-teams play, so its yardage is recorded separately from rushing and passing production. Shaheed’s touchdown counted toward Seattle’s score but did not increase its 365 offensive yards. His 67 receiving yards did enter that offensive total. Keeping the categories separate prevents double-counting and explains how a team can score a long touchdown without adding any yards to the conventional offensive yardage comparison.
6. How much did third-down performance matter?
Seattle converted six of 13 third downs, a 46.2% success rate, while Atlanta converted one of 13, or 7.7%. A successful third down usually earns another set of attempts and allows a possession to continue. Atlanta’s low conversion rate repeatedly left it facing fourth down, limiting its ability to sustain scoring drives. Seattle’s advantage was especially useful after halftime, when continuing possessions helped turn its lead into a comfortable margin.
7. What do the red-zone statistics reveal?
Seattle scored touchdowns on two of four red-zone possessions, while Atlanta scored none on four. The red zone is the area inside the opponent’s 20-yard line, where an offense is close enough to threaten a touchdown. Atlanta’s result shows that reaching scoring territory was not enough. Seattle’s 28-yard touchdown pass also illustrates a limitation of this measure: a touchdown scored from outside the red zone does not count as a red-zone conversion.
8. Why did Darnell Mooney’s apparent touchdown not count?
Mooney’s late second-quarter catch in the end zone was ruled incomplete because he had stepped out of bounds before catching the pass and had not re-established himself in bounds. Officials judged that he went out on his own rather than being forced out. Atlanta therefore faced fourth down and settled for Gonzalez’s 43-yard field goal. The apparent touchdown did not enter Cousins’ passing totals or Mooney’s receiving statistics.
9. Did Seattle win because it recorded more sacks?
No. The final gamebook records two Atlanta sacks, credited to James Pearce Jr. and Kentavius Street, against one Seattle sack by Emmanwori. Seattle’s defense had the stronger overall result because it prevented touchdowns, disrupted third downs, and forced three turnovers. Sack totals identify one form of pressure, but they do not capture every rushed throw, pass breakup, or tackle that stops a possession. Atlanta’s early sacks did not prevent Seattle’s later scoring.
10. Why was the winning margin exactly 28 points?
Both kickers made three field goals, giving each team nine points from those kicks. Seattle’s additional scoring came from four touchdowns and four extra points, worth 28 points altogether. Atlanta scored no touchdowns, so that entire difference remained on the scoreboard. Three Seattle touchdowns came through passes and one through a kickoff return. This scoring breakdown shows why similar field-goal production could not keep Atlanta close once Seattle began reaching the end zone.
Recommended: Colorado Rockies vs Mets Match Player Stats: Full Box Score and Key Performances





One Comment